 Quebec Region Classifier
A fine-tuned EfficientNet-V2-M that classifies street-level photos into one of Quebec's 17 administrative regions, trained on a self-collected, spatially stratified Mapillary dataset.

Overview
A fine-tuned EfficientNet-V2-M that classifies street-level photos into one of Quebec’s 17 administrative regions.
Results
| Split | Accuracy |
|---|---|
| Validation | 92.0% |
| Test | 89.8% |
The ~2% gap between validation and test accuracy is expected: both splits are drawn from the same image pool, but the test set is held out from the start and never influences model selection. The remaining gap reflects genuinely ambiguous cases at administrative borders, where a street photo on either side of a boundary can look identical.
Global metrics (test set, 1909 images)
| Metric | Macro avg | Weighted avg |
|---|---|---|
| Precision | 0.899 | 0.899 |
| Recall | 0.898 | 0.898 |
| F1-score | 0.898 | 0.898 |
Per-region metrics (test set)
| Region | Precision | Recall | F1 |
|---|---|---|---|
| Côte-Nord | 1.000 | 1.000 | 1.000 |
| Nord-du-Québec | 0.982 | 0.991 | 0.987 |
| Abitibi-Témiscamingue | 0.956 | 0.956 | 0.956 |
| Chaudière-Appalaches | 0.963 | 0.938 | 0.950 |
| Centre-du-Québec | 0.946 | 0.946 | 0.946 |
| Bas-Saint-Laurent | 0.930 | 0.955 | 0.943 |
| Saguenay-Lac-Saint-Jean | 0.893 | 0.964 | 0.927 |
| Gaspésie–Îles-de-la-Madeleine | 0.904 | 0.920 | 0.912 |
| Estrie | 0.868 | 0.938 | 0.901 |
| Montérégie | 0.899 | 0.867 | 0.883 |
| Montréal | 0.850 | 0.903 | 0.876 |
| Laval | 0.868 | 0.876 | 0.872 |
| Outaouais | 0.911 | 0.821 | 0.864 |
| Laurentides | 0.865 | 0.804 | 0.833 |
| Mauricie | 0.830 | 0.830 | 0.830 |
| Lanaudière | 0.780 | 0.814 | 0.797 |
| Capitale-Nationale | 0.832 | 0.750 | 0.789 |
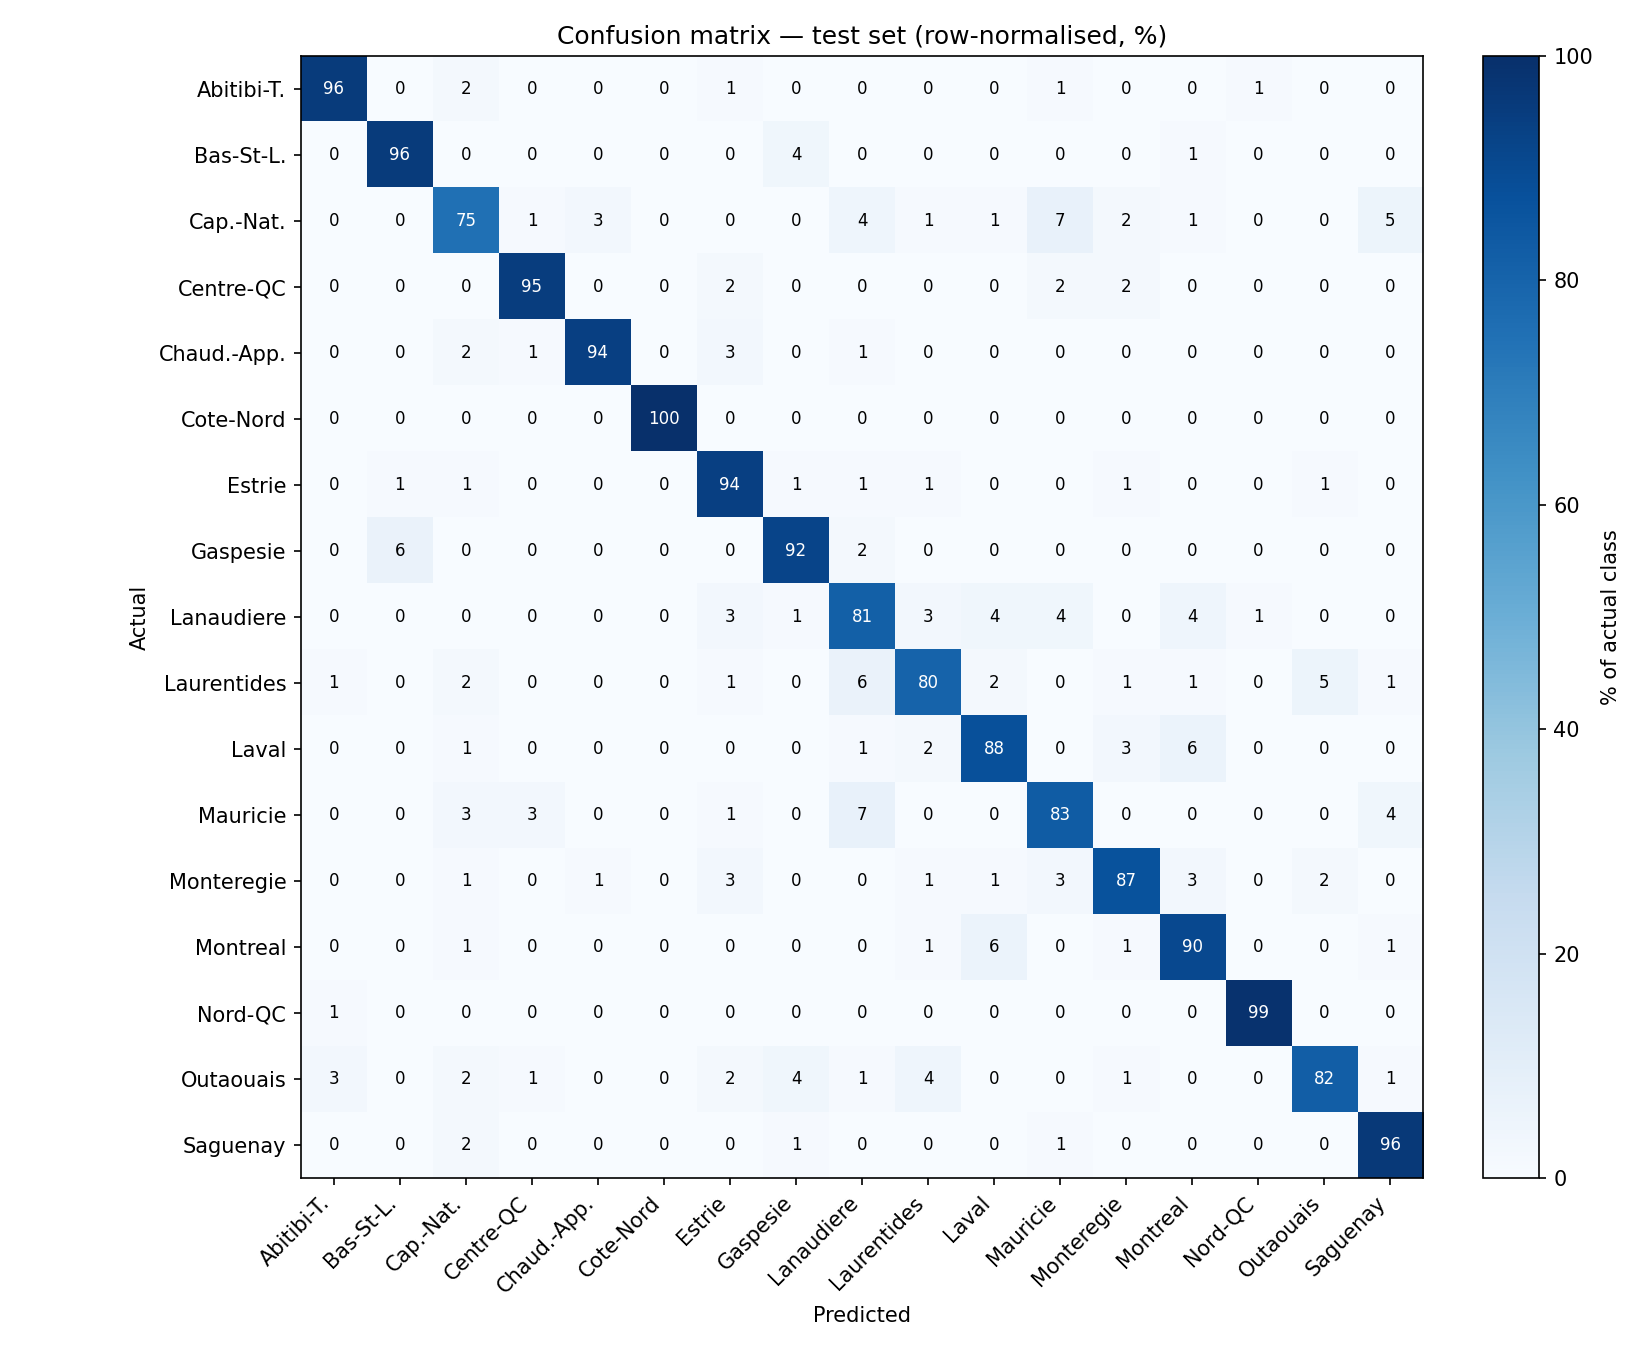
Geographically isolated regions (Côte-Nord, Nord-du-Québec, Abitibi-Témiscamingue) score near-perfect on the test set. The main failure modes are adjacent urban or St. Lawrence valley pairs — Capitale-Nationale is confused with Mauricie and Saguenay-Lac-Saint-Jean, and the Montréal / Laval / Montérégie metro cluster accounts for most of the remaining errors.
Dataset
Street-level images sourced from the Mapillary API, ~750 per region.
- Coverage scan — an async grid scan at 0.03° cell resolution counts available images per region before sampling.
- Sampling — a spatially stratified sample of ~750 images per region, with grid cells filtered to those whose center falls within the official OSM boundary polygon, one image per sequence per cell to avoid near-duplicate dashcam frames, and a finer 0.008° cell size for Montréal/Laval to account for their density and small area.
- Validation — checks image counts, corrupt files, and spatial spread per region.
- Split — an 85/15 stratified train/test split by region, with an 11.1% stratified validation split carved from the training set, giving roughly 75% train / 10% val / 15% test.
Model
- Backbone: EfficientNet-V2-M (ImageNet pretrained via torchvision)
- Head: Dropout(0.4) + Linear → 17 classes
- Input: 480×480 (cropped from 512×512 cached tensors)
- Training: two-phase on a Kaggle GPU — phase 1 (5 epochs, AdamW lr=1e-3) trains the head only with the backbone frozen; phase 2 (15 epochs, AdamW lr=5e-5) fully fine-tunes with cosine annealing
- Regularisation: label smoothing 0.1, gradient accumulation (effective batch 32), mixed precision
The trained model is exported to ONNX (opset 17) and converted to FP16 for inference.
Inference
Preprocessing must replicate training transforms exactly — silent mismatches here are the most common source of degraded inference accuracy:
- Resize to 512×512 (bilinear)
- Center-crop to 480×480
- Convert to float, divide by 255
- Normalize with ImageNet mean/std
import numpy as np
import onnxruntime as ort
from PIL import Image

MEAN = np.array([0.485, 0.456, 0.406], dtype=np.float32)
STD  = np.array([0.229, 0.224, 0.225], dtype=np.float32)

def preprocess(path: str) -> np.ndarray:
    img = Image.open(path).convert("RGB").resize((512, 512), Image.BILINEAR)
    img = img.crop((16, 16, 496, 496))  # center crop 480x480
    x = np.array(img, dtype=np.float32) / 255.0
    x = (x - MEAN) / STD
    return x.transpose(2, 0, 1)[np.newaxis]  # NCHW

sess = ort.InferenceSession("models/geoclassifier-v1-fp16.onnx")
logits = sess.run(["output"], {"input": preprocess("photo.jpg")})[0]
Setup
uv sync
echo "MAPILLARY_TOKEN=your_token" > .env